Measuring Event Success: Beyond Registration Numbers

Registration numbers remain one of the most obvious indicators for evaluating an event’s performance. Known well before the event takes place, they help measure its ability to attract participants and compare its reach with that of previous editions.
But this indicator tells only part of the story. Once the event is over, several other data points can provide a better understanding of the participant experience, the value generated for partners, and the areas that could be improved moving forward.
Beyond the number of people registered, what should we look at to measure the true impact of an event?
A registration confirms a participant’s initial interest, but their behaviour during the event makes it possible to take the analysis much further.
How many registered participants actually attended? Which activities did they take part in? Which workshops or sessions generated the most interest? Did certain parts of the program attract more participants than others?
This data provides a clearer understanding of how participants engaged with the proposed program. A highly attended activity may reveal strong interest in a specific topic or format, while lower attendance may encourage the organizer to reconsider the schedule, content, duration, or the way the activity was presented.
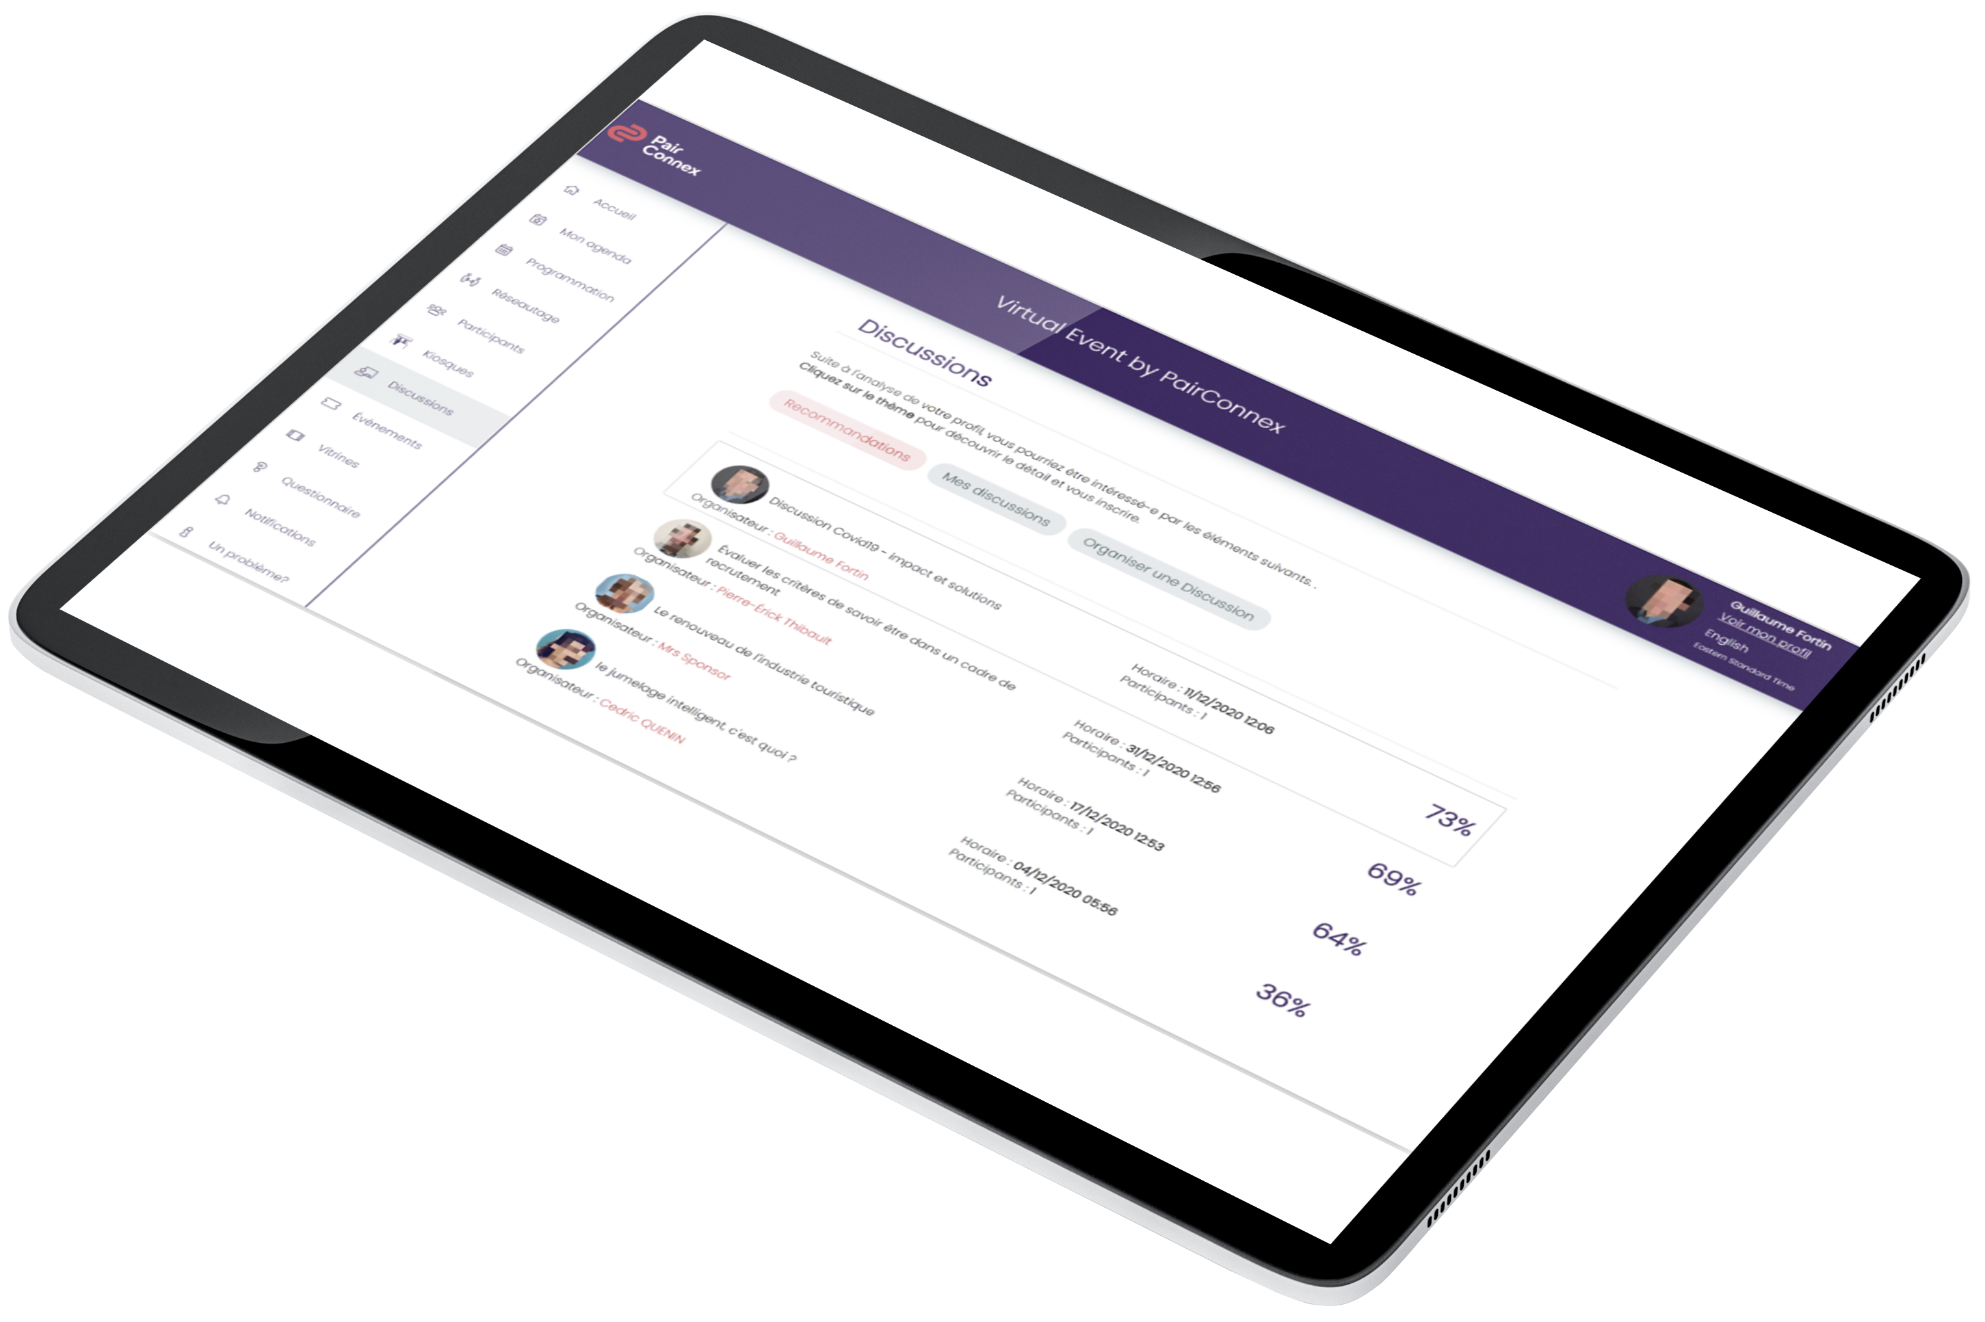
With PairConnex, data related to registrations, activity selections, and attendance can be brought together in a single environment. This allows organizers to more easily compare the interest expressed at the time of registration with the behaviour observed during the event.
For many participants, a large part of an event’s value lies in the meetings and conversations it creates. According to a Freeman study, 51% of participants say that effective networking alone is enough of a reason to return to an event.
It is therefore relevant to measure not only attendance, but also the event’s ability to foster these interactions.
Did participants use the networking tools? How many meetings, appointments, or connections were made? Did they interact with other participants, exhibitors, or partners?
This data helps assess the extent to which the event’s design, program, and participant tools genuinely encouraged opportunities for connection.
The networking and connection data collected through PairConnex can help organizers better understand participant behaviour and identify the initiatives that generated the most interactions.
For many events, partners and exhibitors play an important role in the financial model. Their satisfaction and retention therefore also depend on the organizer’s ability to clearly demonstrate the value generated by their participation.
What visibility did they receive? How many interactions did they have with participants? Did certain presences or activations generate more interest? Which spaces experienced the highest traffic? Were connections or leads generated?
This information makes it possible to go beyond impressions and support partner reporting with concrete data. It helps demonstrate their return on investment more effectively and can become an important tool for encouraging their continued participation from one edition to the next.
It can also help organizers enhance their packages, adapt the visibility opportunities they offer, and better respond to exhibitors’ objectives at future editions.
PairConnex’s Visibility Spaces, networking tools, and various reports can help bring together much of this information and provide a more complete picture of the visibility and results achieved by partners and exhibitors.
Quantitative data shows what happened, but it does not always explain why.
An activity may, for example, have attracted many participants without fully meeting their expectations. Conversely, an activity with lower attendance may have generated a high level of satisfaction among those who participated.
Surveys, comments, and other forms of feedback add this qualitative dimension to the event assessment. Did participants appreciate the content offered? Did they find the program relevant? How do they evaluate their overall experience? What elements would they like to see return or evolve at a future edition?
By comparing these responses with participation and engagement data, organizers can interpret the results more accurately. Low attendance may be related to the topic of an activity, but it may also be influenced by its schedule, duration, or visibility within the program. Feedback helps distinguish between these different possibilities.
No single indicator can tell the full story of an event.
Registrations help assess its ability to attract participants. Participation behaviour shows how the program was used. Interactions and connections provide insight into engagement and networking levels. Partner-related data helps evaluate the value generated, while surveys and comments add the participants’ perspective.
By combining this information, organizers can truly identify what worked well, which content generated the most interest, how participants behaved, and which elements should be adjusted.
Centralizing several of these data points in a platform such as PairConnex makes them easier to review and connect. Information from registrations and ticketing, activities, networking, exhibitor interactions, commercial data, and feedback can therefore contribute to a more complete assessment of the event.
For an event assessment to be genuinely useful, the indicators being analyzed must naturally align with the event’s objectives. This is why it is beneficial to identify the relevant data to collect from the planning stage onward, whether related to participation, engagement, networking, partner visibility, satisfaction, or commercial performance.
Once the event is over, this data becomes, above all, a decision-making tool. It helps determine what should be maintained, improved, or reconsidered for the next edition.
Measuring an event’s success is therefore not simply about producing a report. It is about using what each edition teaches us to make better decisions for the next one.
But this indicator tells only part of the story. Once the event is over, several other data points can provide a better understanding of the participant experience, the value generated for partners, and the areas that could be improved moving forward.
Beyond the number of people registered, what should we look at to measure the true impact of an event?
How Did Participants Engage With the Program?
A registration confirms a participant’s initial interest, but their behaviour during the event makes it possible to take the analysis much further.
How many registered participants actually attended? Which activities did they take part in? Which workshops or sessions generated the most interest? Did certain parts of the program attract more participants than others?
This data provides a clearer understanding of how participants engaged with the proposed program. A highly attended activity may reveal strong interest in a specific topic or format, while lower attendance may encourage the organizer to reconsider the schedule, content, duration, or the way the activity was presented.
With PairConnex, data related to registrations, activity selections, and attendance can be brought together in a single environment. This allows organizers to more easily compare the interest expressed at the time of registration with the behaviour observed during the event.
What Level of Interaction and Networking Did the Event Generate?
For many participants, a large part of an event’s value lies in the meetings and conversations it creates. According to a Freeman study, 51% of participants say that effective networking alone is enough of a reason to return to an event.
It is therefore relevant to measure not only attendance, but also the event’s ability to foster these interactions.
Did participants use the networking tools? How many meetings, appointments, or connections were made? Did they interact with other participants, exhibitors, or partners?
This data helps assess the extent to which the event’s design, program, and participant tools genuinely encouraged opportunities for connection.
The networking and connection data collected through PairConnex can help organizers better understand participant behaviour and identify the initiatives that generated the most interactions.
What Value Did the Event Generate for Partners and Exhibitors?
For many events, partners and exhibitors play an important role in the financial model. Their satisfaction and retention therefore also depend on the organizer’s ability to clearly demonstrate the value generated by their participation.
What visibility did they receive? How many interactions did they have with participants? Did certain presences or activations generate more interest? Which spaces experienced the highest traffic? Were connections or leads generated?
This information makes it possible to go beyond impressions and support partner reporting with concrete data. It helps demonstrate their return on investment more effectively and can become an important tool for encouraging their continued participation from one edition to the next.
It can also help organizers enhance their packages, adapt the visibility opportunities they offer, and better respond to exhibitors’ objectives at future editions.
PairConnex’s Visibility Spaces, networking tools, and various reports can help bring together much of this information and provide a more complete picture of the visibility and results achieved by partners and exhibitors.
How Did Participants Experience the Event?
Quantitative data shows what happened, but it does not always explain why.
An activity may, for example, have attracted many participants without fully meeting their expectations. Conversely, an activity with lower attendance may have generated a high level of satisfaction among those who participated.
Surveys, comments, and other forms of feedback add this qualitative dimension to the event assessment. Did participants appreciate the content offered? Did they find the program relevant? How do they evaluate their overall experience? What elements would they like to see return or evolve at a future edition?
By comparing these responses with participation and engagement data, organizers can interpret the results more accurately. Low attendance may be related to the topic of an activity, but it may also be influenced by its schedule, duration, or visibility within the program. Feedback helps distinguish between these different possibilities.
Combining Data to Build a More Complete Picture
No single indicator can tell the full story of an event.
Registrations help assess its ability to attract participants. Participation behaviour shows how the program was used. Interactions and connections provide insight into engagement and networking levels. Partner-related data helps evaluate the value generated, while surveys and comments add the participants’ perspective.
By combining this information, organizers can truly identify what worked well, which content generated the most interest, how participants behaved, and which elements should be adjusted.
Centralizing several of these data points in a platform such as PairConnex makes them easier to review and connect. Information from registrations and ticketing, activities, networking, exhibitor interactions, commercial data, and feedback can therefore contribute to a more complete assessment of the event.
From Event Assessment to Decisions for the Next Edition
For an event assessment to be genuinely useful, the indicators being analyzed must naturally align with the event’s objectives. This is why it is beneficial to identify the relevant data to collect from the planning stage onward, whether related to participation, engagement, networking, partner visibility, satisfaction, or commercial performance.
Once the event is over, this data becomes, above all, a decision-making tool. It helps determine what should be maintained, improved, or reconsidered for the next edition.
Measuring an event’s success is therefore not simply about producing a report. It is about using what each edition teaches us to make better decisions for the next one.